1. Click "CRM" section.

2. Click "Dashboard"

3. The top section of the CRM Dashboard displays overall statistics for all CRM users, including:
- Average Sales Cycle (in days)
- Close Rate (percentage)
- Average Deal Size (amount)
- Total Closed Sales (amount)
These metrics provide a quick overview of sales performance across the organization.

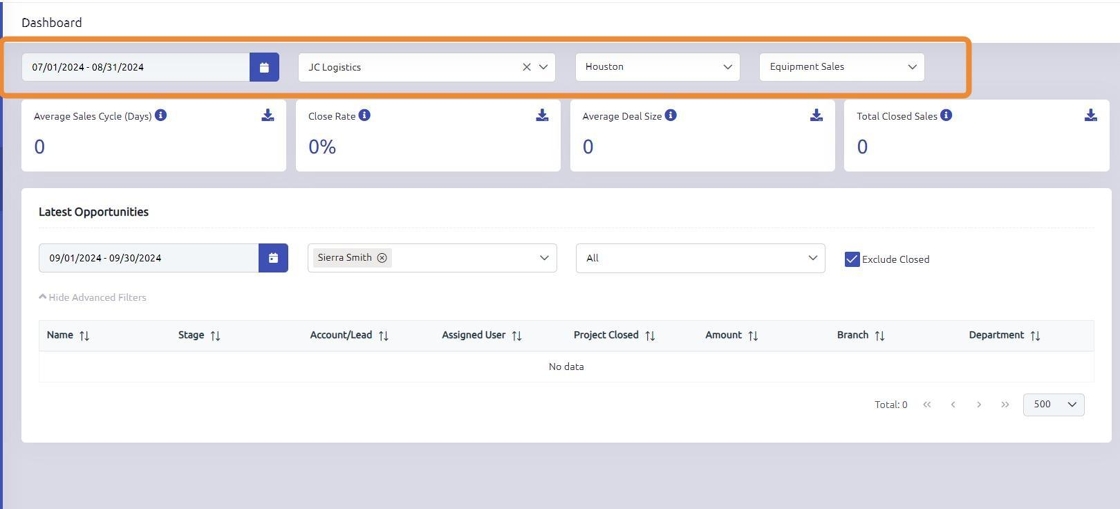
4. You can filter CRM metrics using the following fields:
- Date Range: Select a custom date range using the calendar feature.
- Filter by Account: Use the drop-down menu to filter metrics by a specific account.
- Branch and Department: Filter by specific branches or departments, such as Equipment Sales or Service.

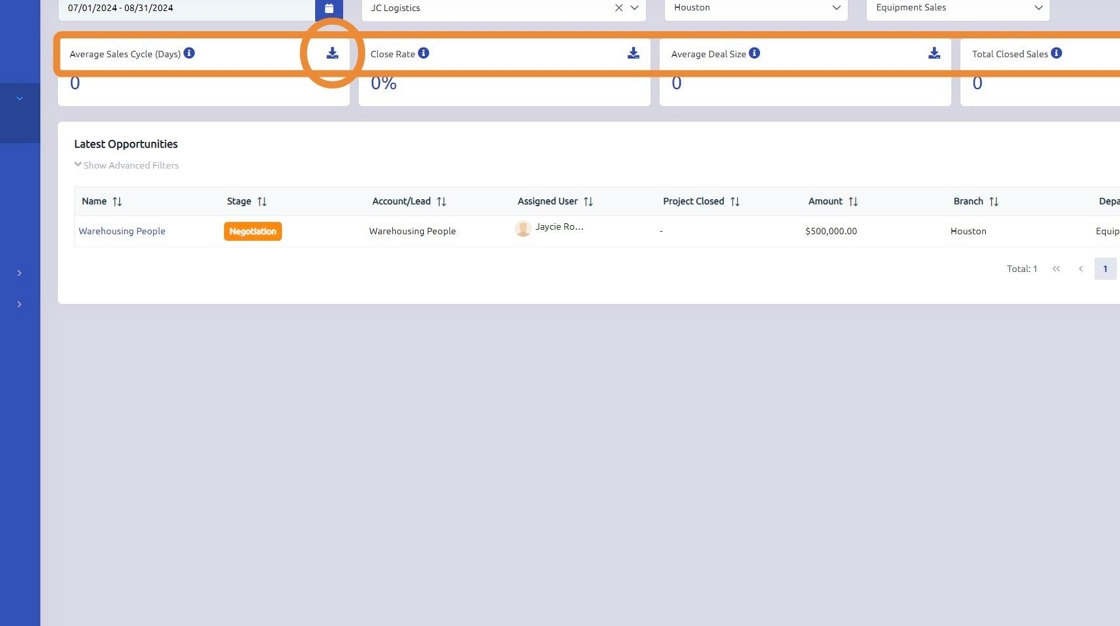
5. Each section of CRM metrics can be exported to an Excel file for further analysis and review. This allows for deeper insights and easier data manipulation outside of the CRM system.

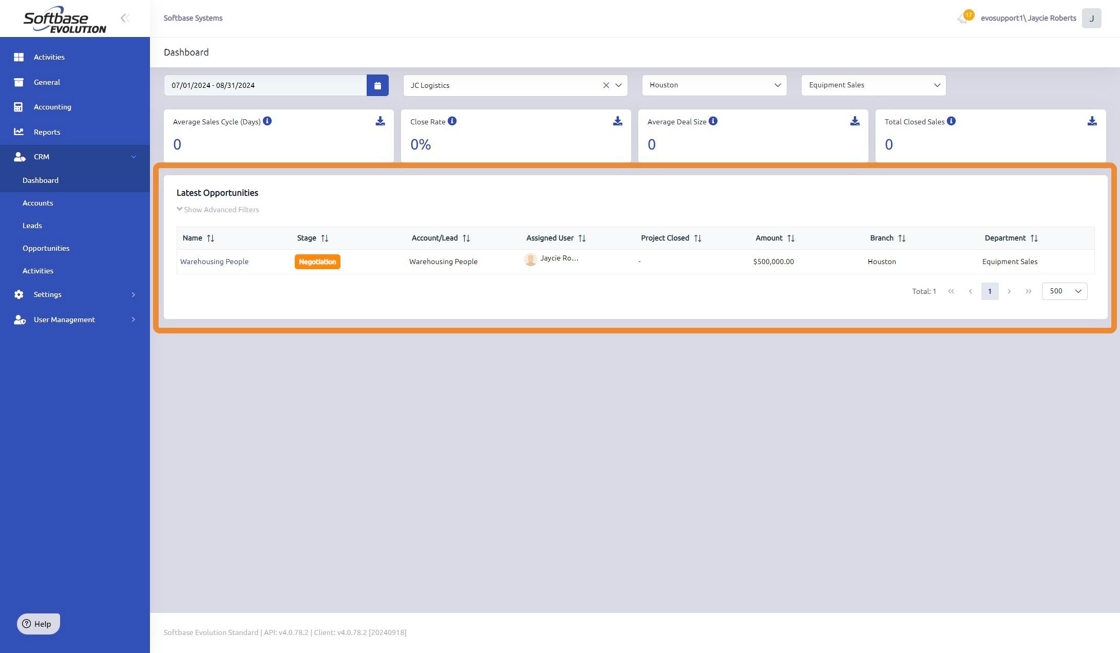
6. The Latest Opportunities section displays both open and closed opportunities, providing a quick overview of recent activity and sales progress.

7. Click the "Show Advanced Filters" button to view additional filtering options for this section.

8. The Latest Opportunities section can be filtered using the following fields:
- Date Range: Use the calendar feature to select a custom date range.
- Filter by Assignee: Select from the drop-down menu to filter by assignee (multiple selections can be made).
- Filter by Stage: Filter by the status of the opportunity or lead.
- Exclude Closed: Selecting this checkbox will remove closed opportunities and leads from the view, allowing you to focus only on open opportunities.

9. Each column in the Latest Opportunities section can be sorted for easier navigation. Additionally, any opportunity or lead can be clicked on and opened by selecting the hyperlinked entry for detailed viewing.

Was this article helpful?
That’s Great!
Thank you for your feedback
Sorry! We couldn't be helpful
Thank you for your feedback
Feedback sent
We appreciate your effort and will try to fix the article